HOW TO PRESENT STATISTICS
HOW TO PRESENT STATISTICS
Les connaissances linguistiques de base :
1) Savoir lire les chiffres, les nombres décimaux, les pourcentages, les dates.
2) Savoir utiliser les comparatifs et les superlatifs.
3) Savoir choisir entre present et present perfect, et entre preterit et present perfect.
4) connaître le vocabulaire de base : , a line graph, a curve, a chart, a bar chart, a pie chart, growth, fall, fluctuate, increase, decrease, skyrocket, plummet, collapse, a percentage, a proportion.
La méthode :
1) Présentez le document :
- nature (a line graph? a chart? a bar chart?, a pie chart?)
- titre ( it is entitled...)
- information générale : de quoi traite le document, et quelle est la nature de l' information (si elle n'est pas déjà explicite dans le titre sus-mentionné)
- origin ( it was published in the issue of Newsweek...)
- date ( ...dated May 10th 2008)
2) Etudiez les chiffres et dégagez clairement l'information essentielle apportée par le document.
3) Analysez la. (possible cause, conséquence etc...)
4) Commentez cette information. (illustrez la avec des exemples ou des contre-exemples concrets, donnez votre opinion en la justifiant de façon argumentée).
L'exemple :

Etape 1 :Présentez le document :
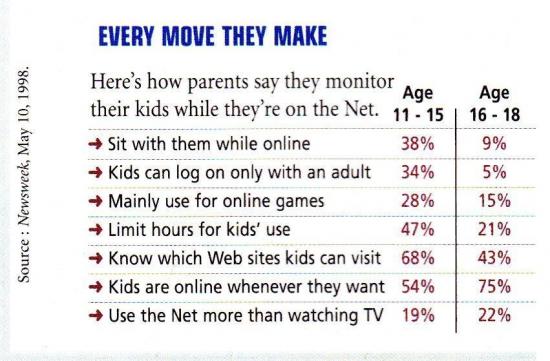
This is a chart entitled " Every move they make", showing the results of a survey. It was published in the issue of Newsweek dated May 10th, 1998.
The problem raised is the way parents monitor their children while they are using the internet. More precisely, it focuses upon teenagers since the word "kids" is used several times and the ages are mentioned ( 11-15 and 16-18).
Etape 2 :Etudiez les chiffres et dégagez clairement l'information essentielle apportée par le document.
If we focus upon the first age category, it seems clear that few of them can use the internet without an adult. Indeed, only 34% / one third, one out of three can surf the web without adult supervision.
Moreover, the figures also highlight the fact that not only do parents watch over the sites they log on to, but half of them also limit the time they spend online : ( 47% ). In 1998, only 19%/one fifth of the teens/one youngster out of ten used the internet more than they watched TV.
For those aged between 16 and 18, things are quite different :
Contrary to/unlike their younger peers, they rarely sit with an adult to use the internet (9%). Only a minority (5%), are not allowed to log on without an adult. Likewise, fewer 16-18-year-olds are limited in time , fewer parents know which site their teenagers visit.
Most of them (75%) are free to use the internet as they choose.
But for TV, the proportions are not very different. The Net is not among the media mostly used by teenagers.
Etape 3 : Analysez la. (possible cause, conséquence etc...)
In conclusion, it is obvious that the older the kids are, the less they need parental control over their use of the Iternet. The older you get, the less parents control your moves. Most teenagers aged 11-15 use the internet to play whereas older ones do some research for school or log on to see their e-mails or communicate through message services. The great number of dangerous and ill-turned sites has encouraged the parents to protect their kids by controlling the sites they go to.
Etape 4 :Commentez cette information. (illustrez la avec des exemples ou des contre-exemples concrets, donnez votre opinion en la justifiant de façon argumentée).
Ten years have passed since this survey was made, and I think the situation is still the same/quite different today. What I mean is that....
